

What you read in this article:
JMeter
My name is Arsalan MirBozorgi and I will try to talk to you about a software called JMeter. This software is one of the products of Apache company. In previous articles, we talked to you about open source software. These software’s are created to perform load testing on a server or group of servers or networks. In the following, we will review the details of JMeter together.
Various components of JMeter
Each part c is called an element. Each of these elements was designed and manufactured for a specific purpose.
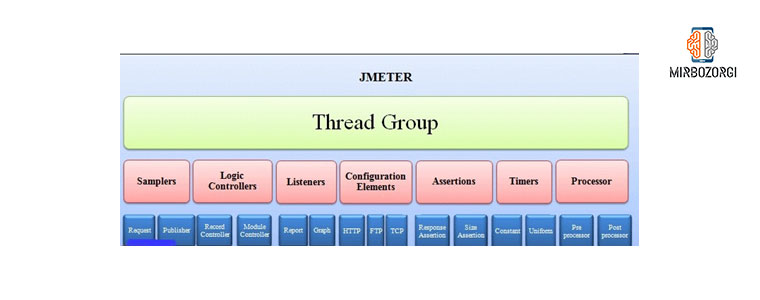
In this article we will talk to you about different elements like Configuration, Samplers, Thread group, and Listeners.
Thread Groups
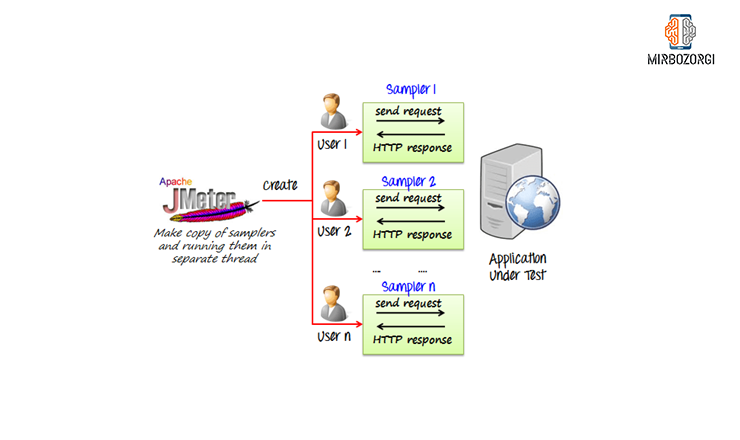
This group includes a set of threads. Each section indicates the user who is using the software under test. In other words, a thread is a simulated instance that sends a request to a server. This group allows you to control a number of threads. For example, if the number of threads is 100, JMeter, based on this number, send100 redirects users to the test server in a simulated way.
Sampling or Samplers
JMeter for the testing process, supports HTTP, FTP, JDBC and other protocols. In this case, the user request can be HTTP Request, JDBC Request or FTP Request.

FTP Request
This controller in JMeter helps you to send a request (download or upload) to the FTP server of this request.
For example, if you want to send a “Test.txt” file from an FTP server tested by JMeter, you should to change some of the parameters in JMeter as shown in the picture:
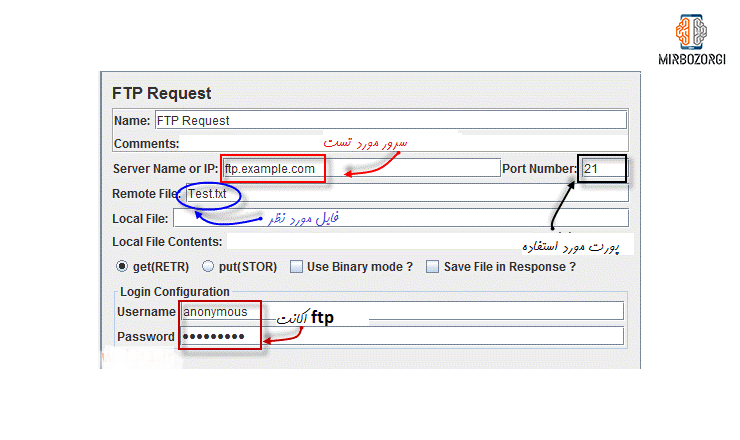
JMeter sends the FTP command to the ftp.example.com server and then downloads a Test.txt file from that server.
HTTP Request
This controller in JMeter helps you to send an HTTP / HTTPS request to the web server which is testing. In the example below, JMeter sends an HTTP request to Google, then retrieves the HTML files or image from that website:

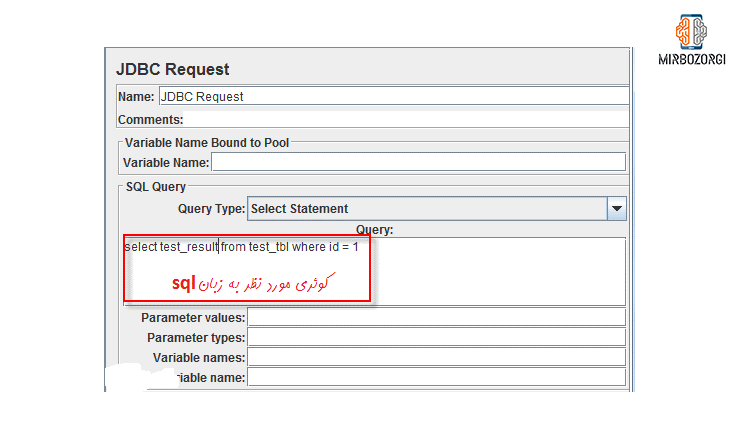
JDBC Request
This controller in JMeter is related to database performance testing. In the following example, a JDBC query (an SQL query) is sent to the database:

Suppose we have a database server which the value test_result is in a table called test_tbl. If you want to test a search to retrieve this data from the database, you can configure the relevant JMeter software to send a SQL search to this server.
 BSF Sampler
This sample allows you to create a sample using a programming language. There is an example of a BSF Sampler running in JMeter:
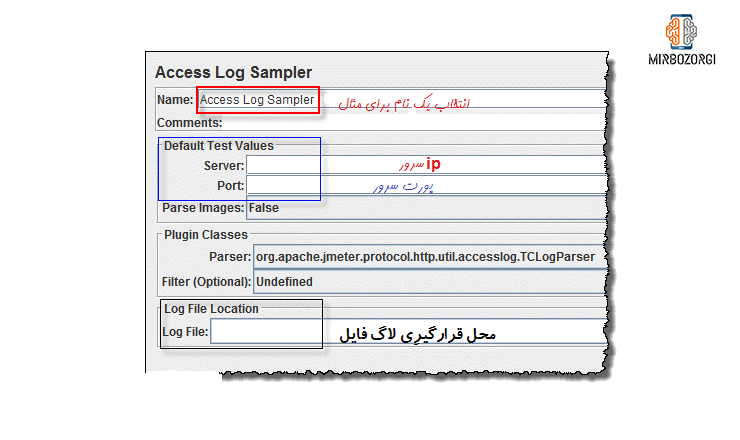
Access Log Sampler
With this sampler, you can read log files and also access these logs. In addition, with this sampler, you can generate HTTP requests.
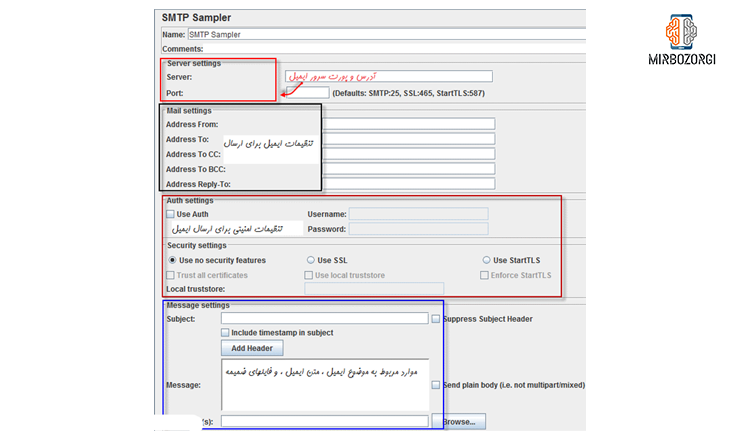
 SMTP Sampler
SMTP Sampler is used to test an e-mail server. This sampler uses the SMTP protocol to send the text of each email to the server you specify:
Listeners
Once you have finished the load test, you can view the results by Listeners in the form of a tree, graph, table, chart, and log file:
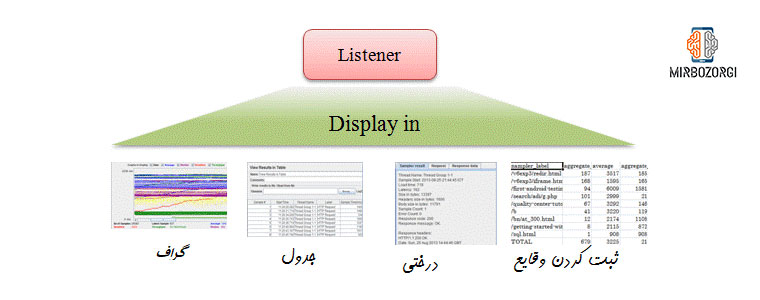
In listeners that are displayed in the form of a graph, the server response time is shown in the form of a graph.
In listeners, the result of the user request is displayed as a public HTML file.

In listeners that are of table result type, the test results are displayed in summary form and in tabular form.
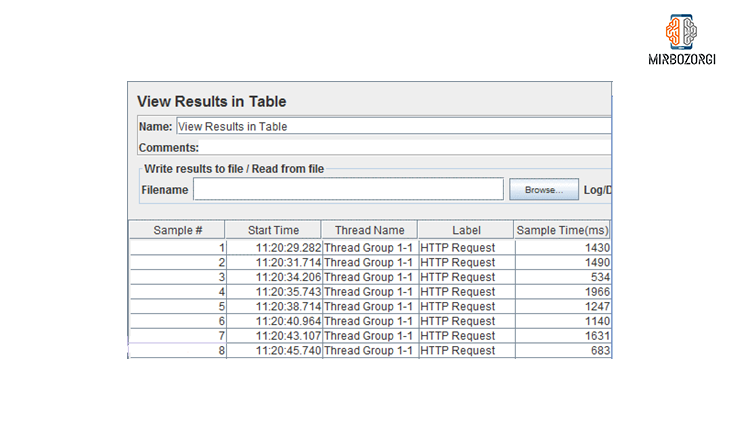
In listeners that are of the Log Result type, such as Table Result Listeners, the test results are displayed in summary form and in tabular form.

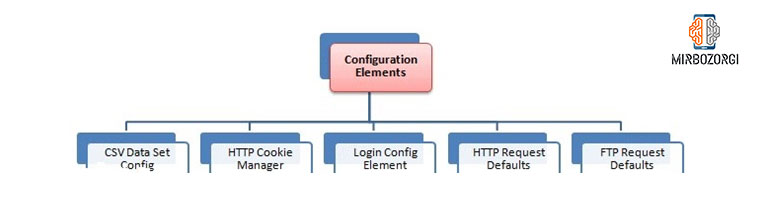
Configuration Elements
Configuration Elements means configuring elements or setting a default value for variables in order to use them next time. You can see some of the routine configuration components in JMeter in the picture:
Configured Dataset or CSV Data Set Config
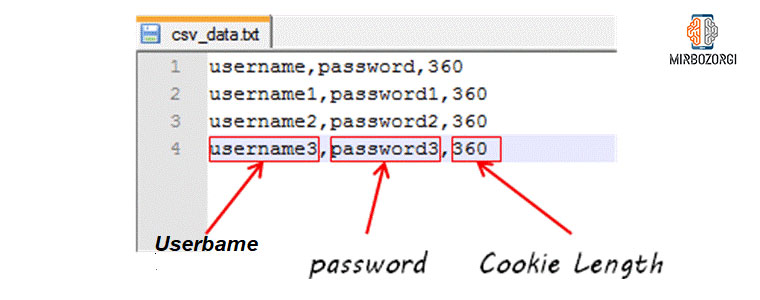
f we have a site with about 100 users and each of these 100 users has a different amount of credibility and we want to test them, we have to run JavaScript 100 times. It is also necessary to enter a different validity in the script parameter for each entry. This information, can include a username or password, can be saved in a text file. JMeter also has an element that reads various parameters of the text file. This feature is called CSV Data Set Config in JMeter.

In the picture below, you can see an example of CSV. In this text file, the username and password required to log in to the site are saved.
HTTP Cookie Management (HTTP Cookie Manager)
One of the most important issues in the IT world is cookie management. When you use a browser to open a search engine like Google and then enter your username and password, this information will be stored as a cookie in your system. If you want to use Google for the second time, you do not need to enter your information a second time, because your information is registered in your system. This issue is controlled by HTTP Cookie Manager in relation to different passwords and usernames. When you have an HTTP request with a response that contains a cookie, the HTTP Cookie Manager automatically saves that cookie for future use.
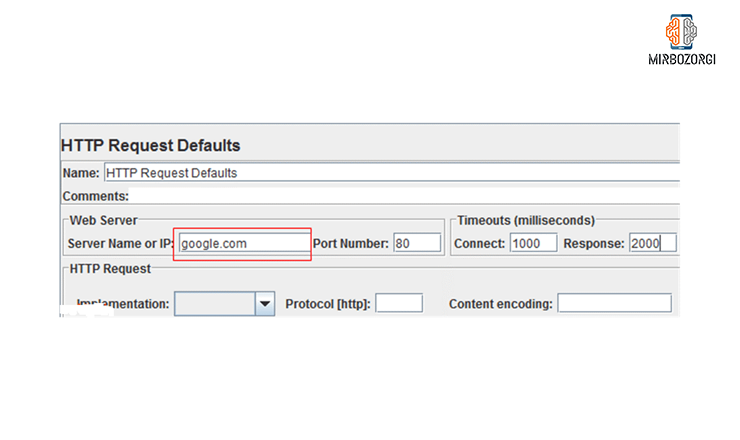
HTTP request default
With this kind of widget, you can set the default values used to control Http Requests. For example, suppose you are sending 100 HTTP requests to a google site server. In this case, you have to manually enter the name of the server you want, which is the google site for every 100 requests. Of course, you can only add one HTTP request by default with the name or IP of the server instead. There is no need to type the server name 100 times.
 Login Config Element Configuration:
With using this element, you can add or ignore usernames and passwords in samplers. For example, if you want to simulate a user entering a particular site with a username and password, you can use the Login Config Element.

CSV Data Config
CSV Data Config is used to simulate user login, simulate user login time number, simulate login parameter only (username and password) and also for use in a large number of parameters. After installing JMeter, you have two elements. One element is the Test Plan and the other is the Workbench, which in the new JMeter instances does not have a separate workbench and has been added to TestPlane.

Test Plan
In the Test Plan software, you can add the elements you need for the JMeter test. This section contains all the elements, including Thread Group, Timers, and…, also the settings needed to run the test you are considering.
In the figure below, an example of the test plan is displayed.

Add Elements
Adding elements is essential to building a test program, because without adding elements, JMeter will not be able to perform the test. Test Plan includes many elements such as Listener, Controller and Timer. You can add new items from the selection list by right-clicking on Test Plan. To better understand this, suppose you want to add 2 elements BeanShell Assertion and Java Request Default to the Test Plan. To do this, you must follow these steps:
1- Right click on Test Plan
2- Add Bean Shell Assertion from Assertion option
3- Right click on Test Plan
4- Add Java Request Default from Config Element option
Save Elements
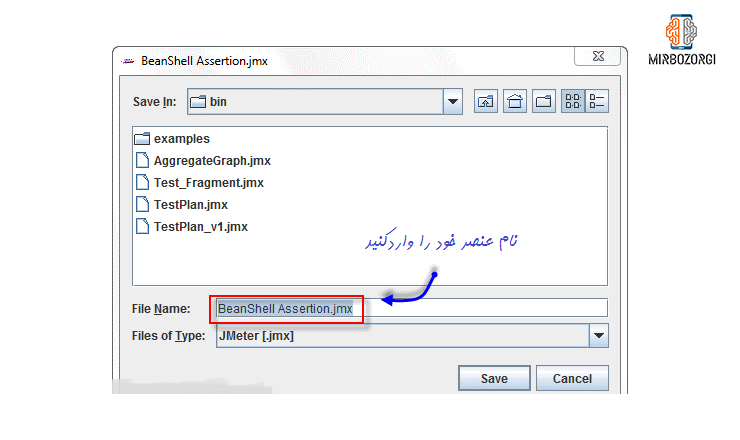
Suppose you added the BeanShell Assertion widget and you want to save it. To do this, right-click on BeanShell Assertion and select Save Selection As.
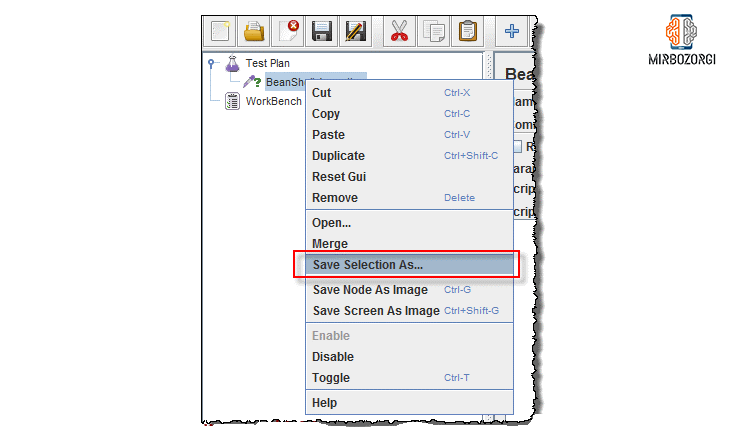
After displaying the dialog box, select the default name and save this element by clicking the Save button. The name of this element can be changed later.
JMeter saves the test elements and the Test Plan in JMX.* format.
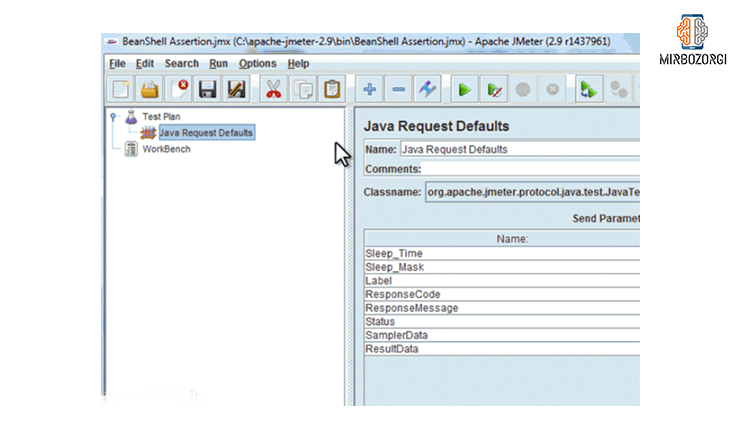
Loading elements
By loading elements, you can save the time you need to create and configure new elements. For example, if we want to load an element in Java Request Default and in the Test Plan section, we must first right-click on Java Request Default and then select Merge.
Then select the BeanShell Assertion.jmx element from the available elements and add it.
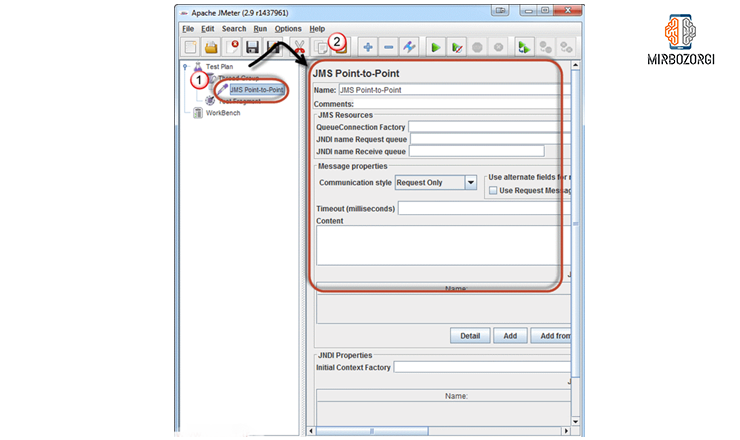
Configure elements
To configure each element, you must select the element from the left window and put your settings in the settings field.
Run and Stop Test Plan
Before running a test, you must first save the Test Plan for your test. Saving it in the test program helps you to prevent unexpected errors while the test program is running.
Steps to Save Test Plan
First, from the File menu, click Save as to open the dialog box. Then enter the phrase “Test Plan” in the field specified for the name and click save. Note that saving a test plan is different from saving an element. Test Plan consists of one or more elements that are an integral part of the JMeter. When you save a Test Plan, all the elements in that program will also be saved.
Performance Testing
Performance testing to determine if a web application or application under test can be required for heavy loading or not. it’s so important. With the result of this test, you can analyze how a server performs against heavy loads.
Advantages of JMeter test tool in performance testing:
JMeter can use static sources such as JavaScript and HTML to test performance, as well as dynamic sources such as JSP, Servlets, and AJAX. JMeter can specify the maximum number of users your website can handle simultaneously. JMeter is also able to display a variety of graphical analysis of performance reports and results.
JMeter performance testing generally includes the following.
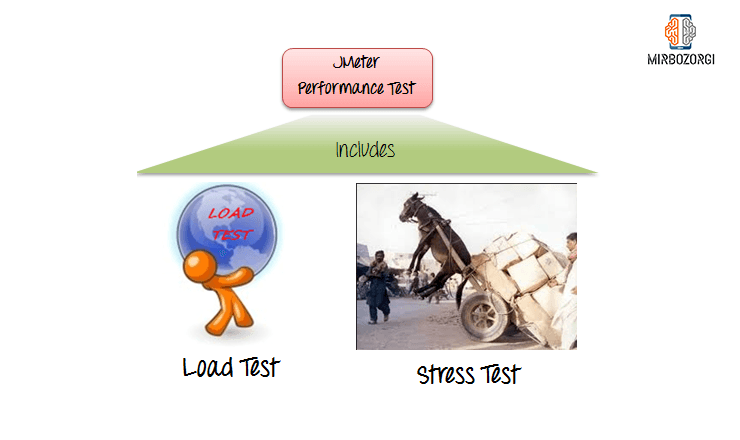
Load Testing
A method for modeling multi-user simultaneous use is by simulating how many users have access to web-related services.
Stress Testing
Each web server has a maximum load capacity. When the load on this web server is so much, the response speed decreases and errors increase. The stress test determines the maximum tolerable load of the web server.
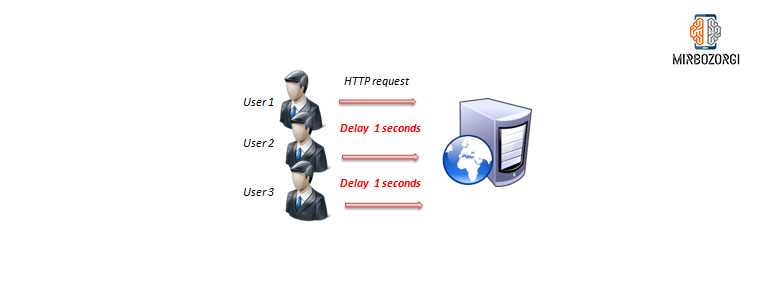
The following picture shows how JMeter simulates heavy loading.
Create Test Plan to Test Performance in Jmeter
In this article, we do a performance test for the Google website with 1000 users. Before starting the performance test, we need to determine the normal load. Normal load is the average number of users who visit your site, and heavy load is the maximum number of users who visit your website. You also need to know what your goal is in this test.
The image below shows the map for this test.
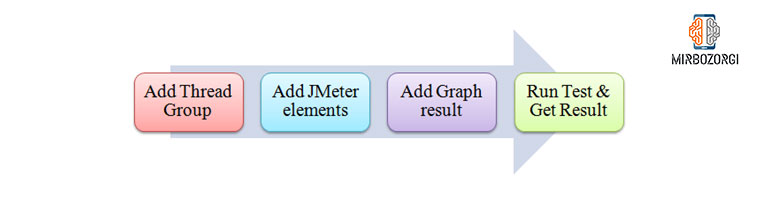
The steps of this test are as follows:
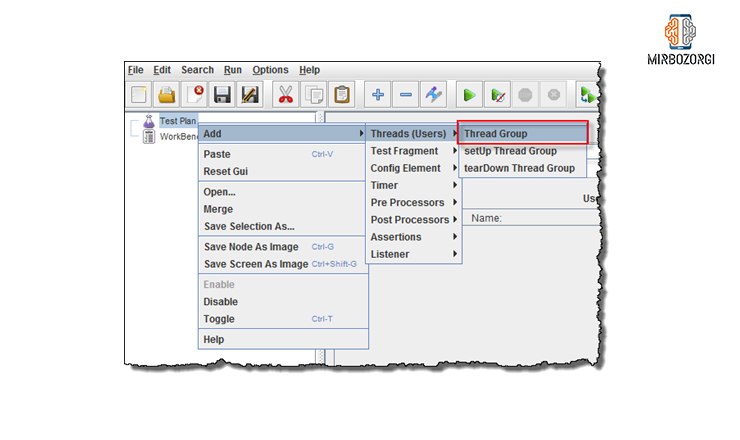
Step 1:
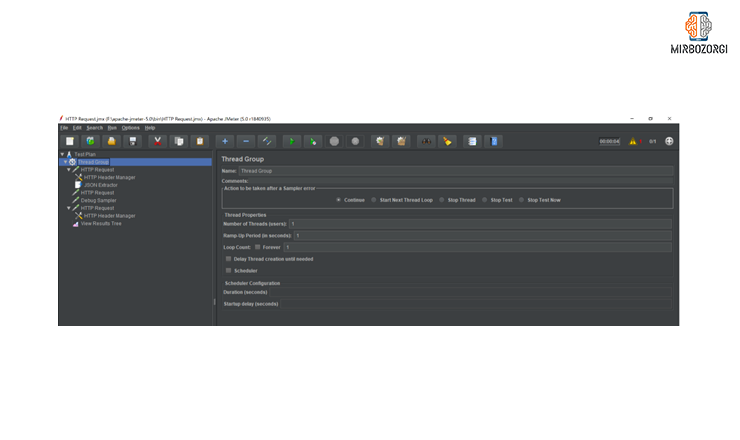
At fists add a thread group. This is done by running the JMeter program and selecting Test Plan and right-clicking on Test Plan and then adding a Thread Group.
In the Thread Group control panel, you should fill in the Properties section as shown below.
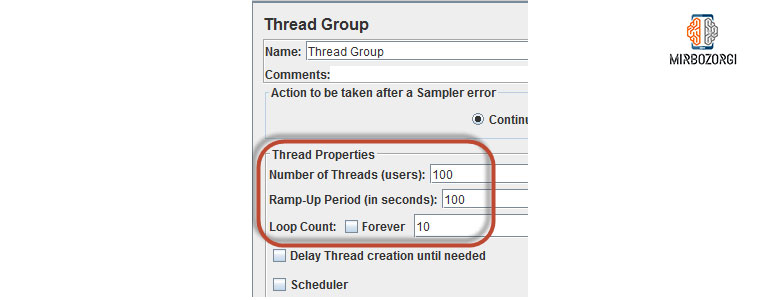
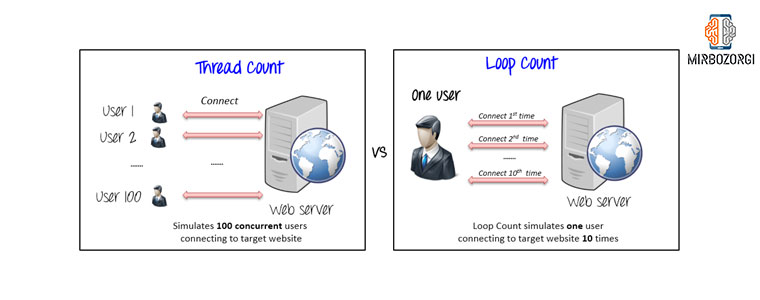
Number of Threads is the number of users who connect to the target website.
Count shows the amount of time required to run the test. The Ramp-Up Period also indicates how long it takes for the next user to start the process. For example, if we have 100 users and a time period of 100 seconds, the amount of time delay between users to start, will be 1 seconds. (100 users / 100 seconds) = 100
In the picture, you can see the difference between Counts Thread and Loop Counts.
Step 2:
In this step you should add JMeter elements. In this step, you should specify the elements needed for the test in JMeter.
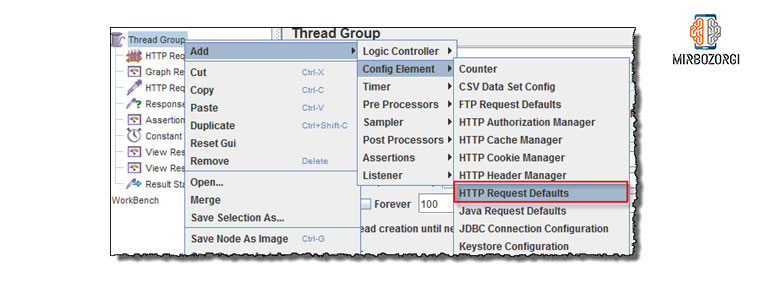
HTTP request Default
To add this element, right-click on the Thread Group and then select Config Element and HTTP Request Defaults by this order.
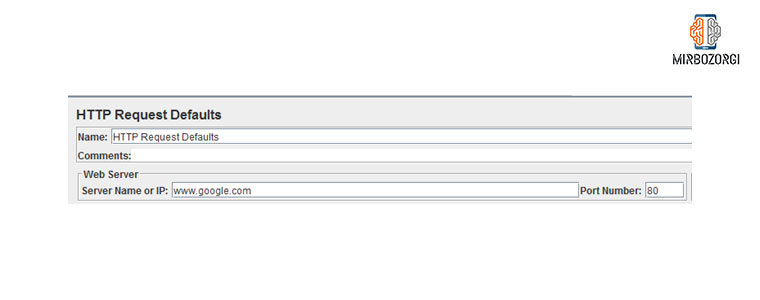
In the HTTP Request Defaults control panel, you should enter the name of the website to be tested. For example (http://www.google.com)
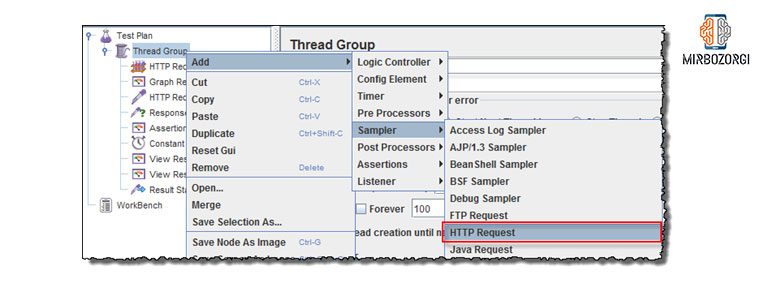
HTTP Request
for adding this element, you should right-click on the Thread Group and then select Sampler and HTTP Request.
In the HTTP Request control panel, the Path section indicates which URL or which google server path is sent through the request you want.
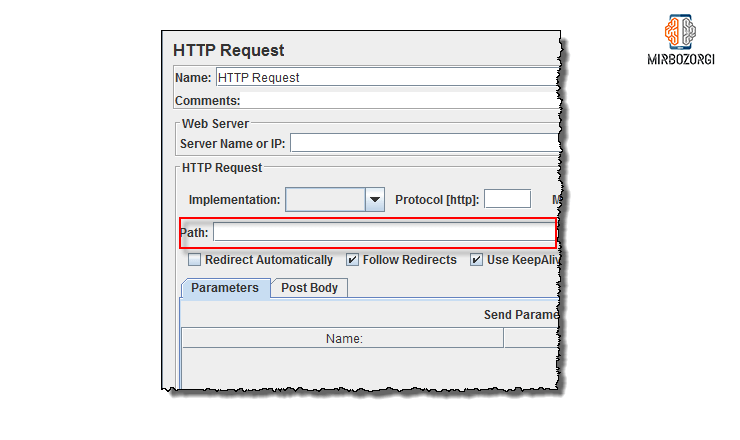 For example, if you enter a value equal to “calendar” in the Path section, JMeter will redirect the URL request you want to http://www.google.com/calendar to google server.

For example, if you enter a value equal to “calendar” in the Path field, JMeter redirects the URL request you want to the Google server as http://www.google.com/calendar.
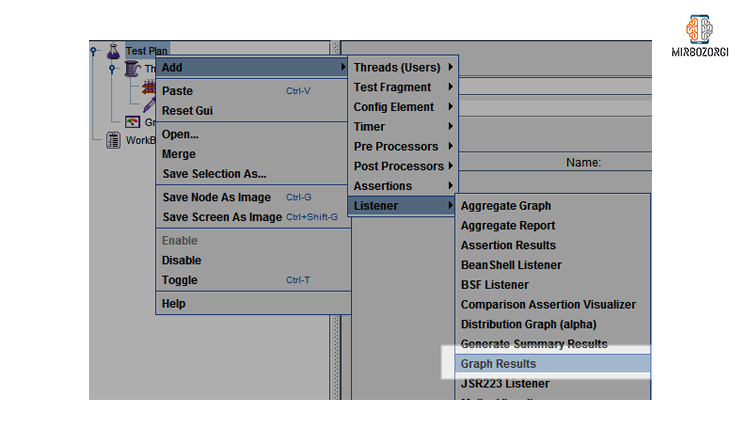
Step 3:
This step is about adding Graph results. JMeter has the cam display the test result in the form of a graph. This is done by selecting the Test Plan and right-clicking on the Listener and then adding the Graph Results.
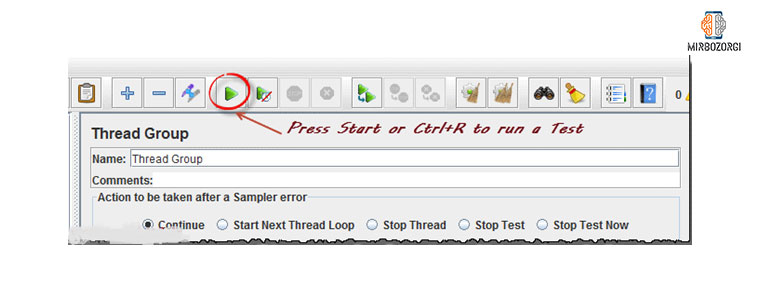
Step 4:
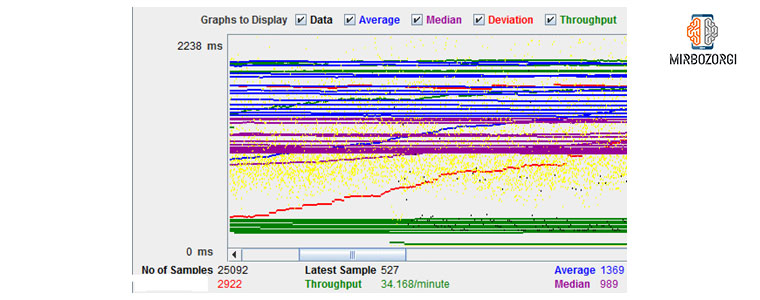
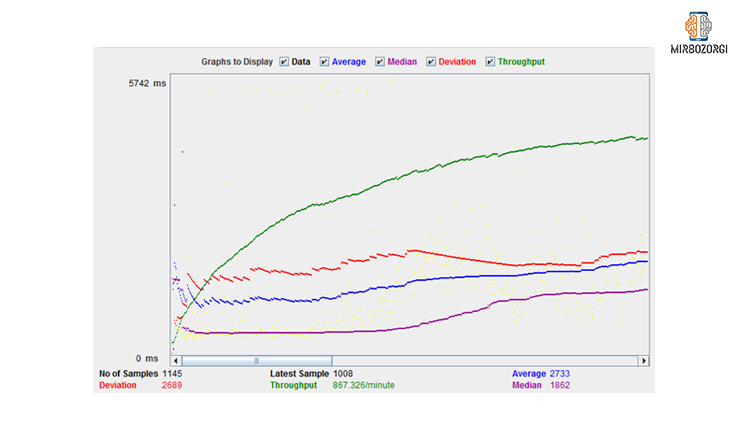
This step is related to running the test and viewing the result. To start the software testing process, press the Run button from the toolbar or its shortcut key equivalent (Ctrl + R) and view the test results on the chart at runtime. In the picture below, you can see the diagram of a test design in which we simulate 100 users who are currently online at www.google.com.
The color codes at the bottom of the image also has a special meaning. The black code means the total number of current samples sent, the blue code means the current average of the samples sent, the red code means the current standard deviation, and the green code means the amount of production that indicates the number of requests per minute on the server side. In the following picture, we want to analyze the performance of Google server.
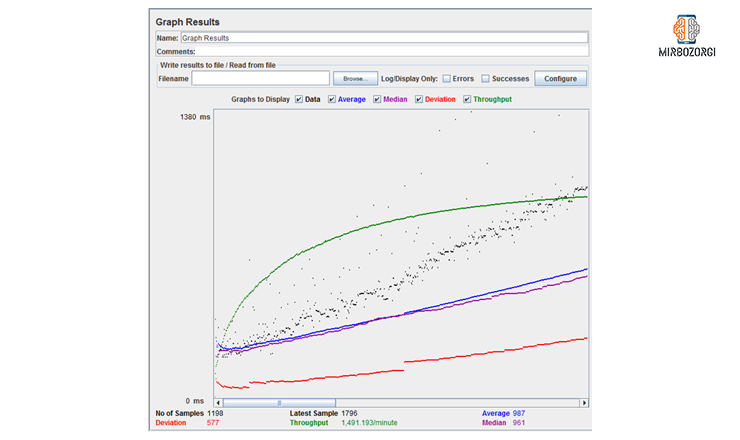
To analyze the performance of the web server under test, you should focus on 2 parameters. These two parameters are throughput and deviation.
Throughput efficiency is a very important parameter. This element shows the server’s ability to load heavily. The higher the density, the better the server performance. In this hypothetical test, the performance of the google site server is 1491163 per minute. This number means that Google Server can make 1491163 requests per minute. This amount is very convenient. Given this result, we can conclude that Google’s server is performing well in this regard.
In this picture, the amount of deviation is shown in red color. This shows actually indicates a deviation from the average, and the smaller it is, the better.
Step 5:
In this step, we want to compare the performance of Google server with another server. This time the performance test will be on the website http://www.yahoo.com/, but you can also test other sites.
The efficiency of the website under test http://www.yahoo.com is 867,326 per minute. This means that this server can respond to 867,326 requests per minute, which is less than Google. Also, its deviation rate is 2689 and is much higher than Google’s deviation rate (577). Based on the results of this test, we can assume that the performance of Yahoo’s website is lower than Google’s server.
Note that getting high values depends on several factors such as your current Google server load, your internet speed, your system CPU power, and so on. Therefore, it is far from expected that you will get the same results as above.
Troubleshooting
If you had any problems while performing these steps, you should do the following:
First check if you are connected to the Internet through a proxy. If yes, you must delete the proxy. Then open a new instance of JMeter and open the Performance Test Plan .jmx in JMeter. Then run the test by clicking on Thread Group and then on Graph Result.
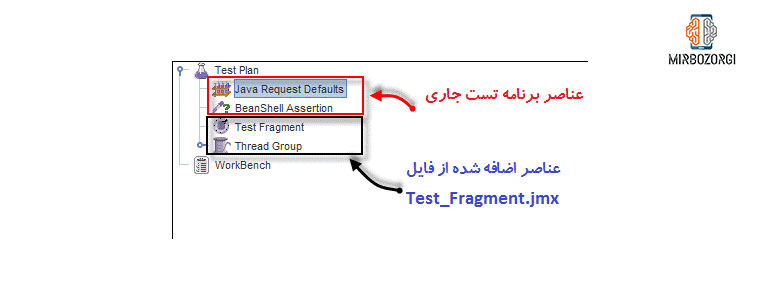
Assume you have a Test Plan called Test_Fragment.jmx on your system. You have the option to integrate this test program with the test program running on your JMeter and create a new test program.
As you can see in the picture below, all the elements in the current test program are added to the running test program in the Test_Fragment.jmx file.
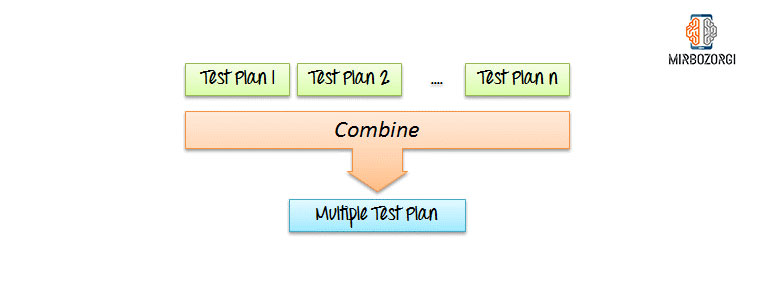
Run Test Plan
To run one or more test programs, click start or press the keys (Ctrl+R).
When JMeter is running, a small green box is shown at the bottom right of the application menu bar.

The number which is shown on the left side of the green box indicates the number of active threads, and the number to the right indicates the total number of threads. You can also press the stop button or use the shortcut keys Ctrl + ‘.’ To stop the test program.
Test Report
When the test program ends, you will be able to receive the test report or test program. This report includes log file errors and a summary of the test result stored in the jmeter.log file.
And in the end,
If we want to use either post or get method in JMeter, we can do so using Json extractor or stackoverflow. To better understand the process, you can view https://www.youtube.com/watch?v=KufhkXgwKFQ videos as well as https://stackoverflow.com/questions/42151962/jmeter-how-to-use-extracted-value-from-response-in-body-data-of-another-reques.
For this purpose, we must first create the thread group, in the photo above, we have a loop and a yuzer that can be changed.
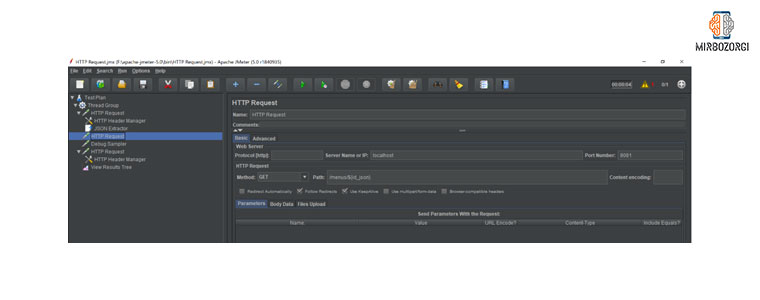
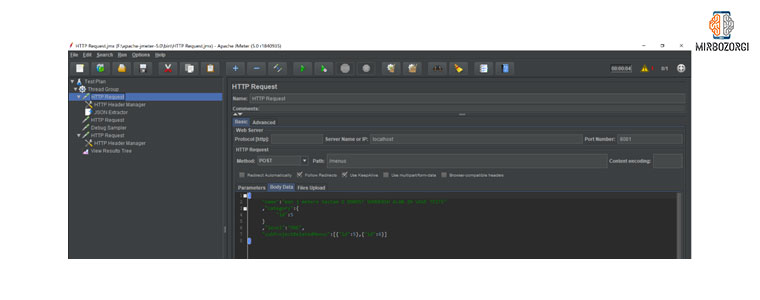 Then we create http request. In the path section, the same api is available in the controller section, and in the body section, the same json is placed in the postman section.
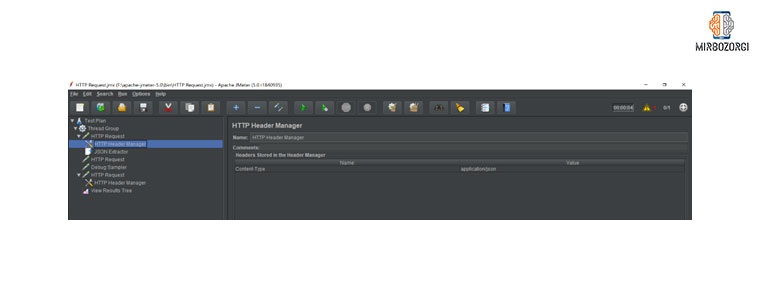
In this section, right-click on http req and add http header manager for the json/app we are using.
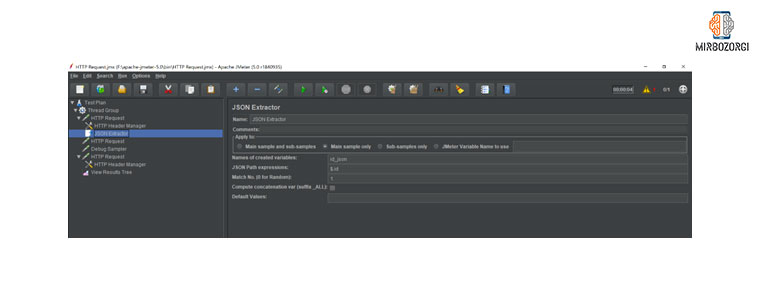
Then click on any request that we want to get the id or anything generated and use immediately. Then right click on the relevant http req and add json extractor. If we needed two values, we put two values in the json path ex field and put two new names for it at the top. You can see an example of this in the link from youtube.
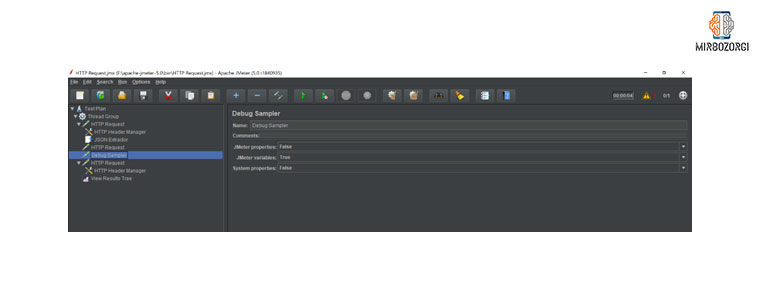
Then we put another http req that wants to use the created value, and it looks like this, in the path variable of the debug to see if that new value is created or not.
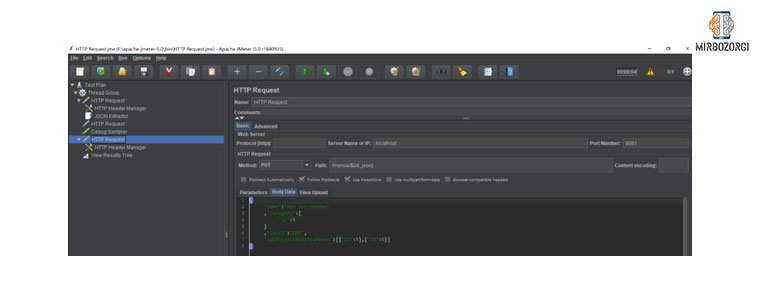 The Pot model should be like the case above.
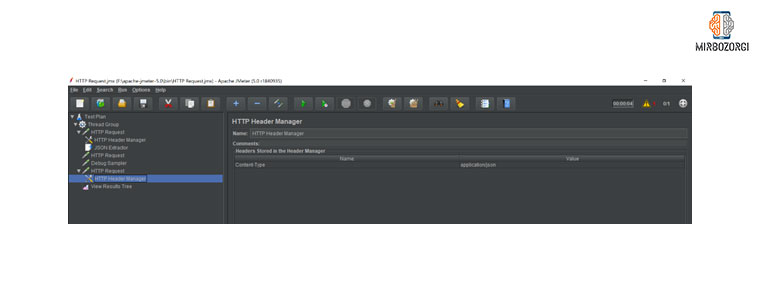 For this pot, we also need a header that we create according to the figure above.
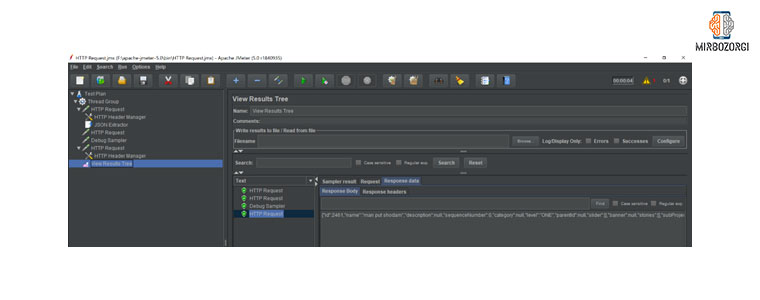
From Lissner, we also create a tree to display the result.
http test script recorder
In the following, we want to check a site, but we don’t know its api, and we also want to do 100 logins and log-outs or anything else. For this purpose, we take action through the commands https://www.youtube.com/watch?v=KufhkXgwKFQ in the video. In this case, http test script recorder or recording controller is used. At the end of the article, we also include the JMeter download link. We hope you have made sufficient use of this article.
JMeter download link: